Case Study 2 of 5 | Back to Case Studies
Comparing the Beans
There are a lot of beans on this site:
With so many similar brands and offerings, chefs and procurement managers need to compare products for specifications and quantities.
76%
of shoppers who use it purchase.
8%
average rate of engagement.
4
Sprints to get through research and design.
4
Sprints to get through development.
Assess the data package. → Research informs design. → Partner with Dev.
Problem Statement
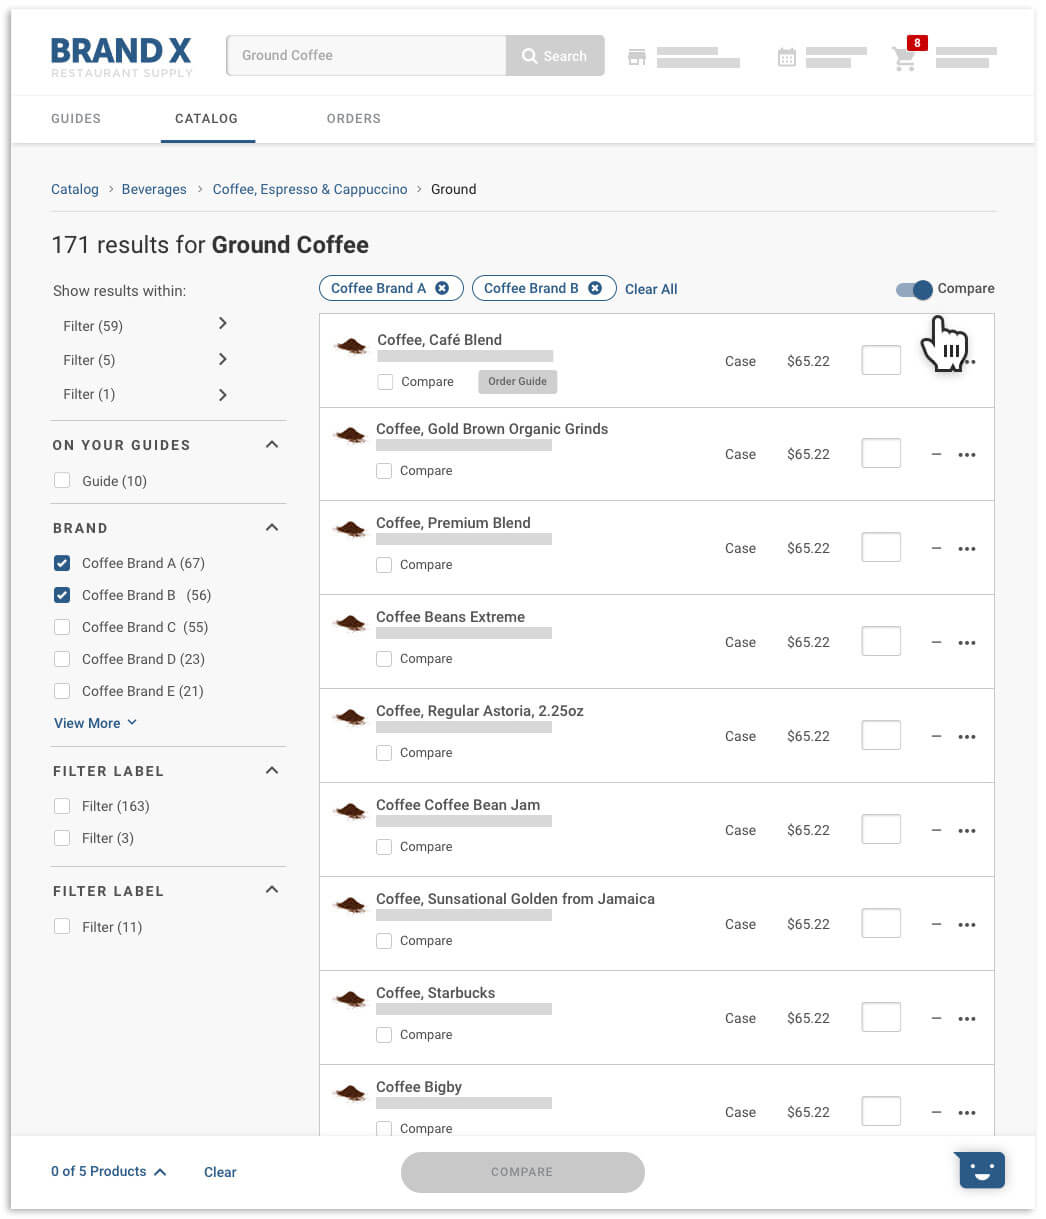
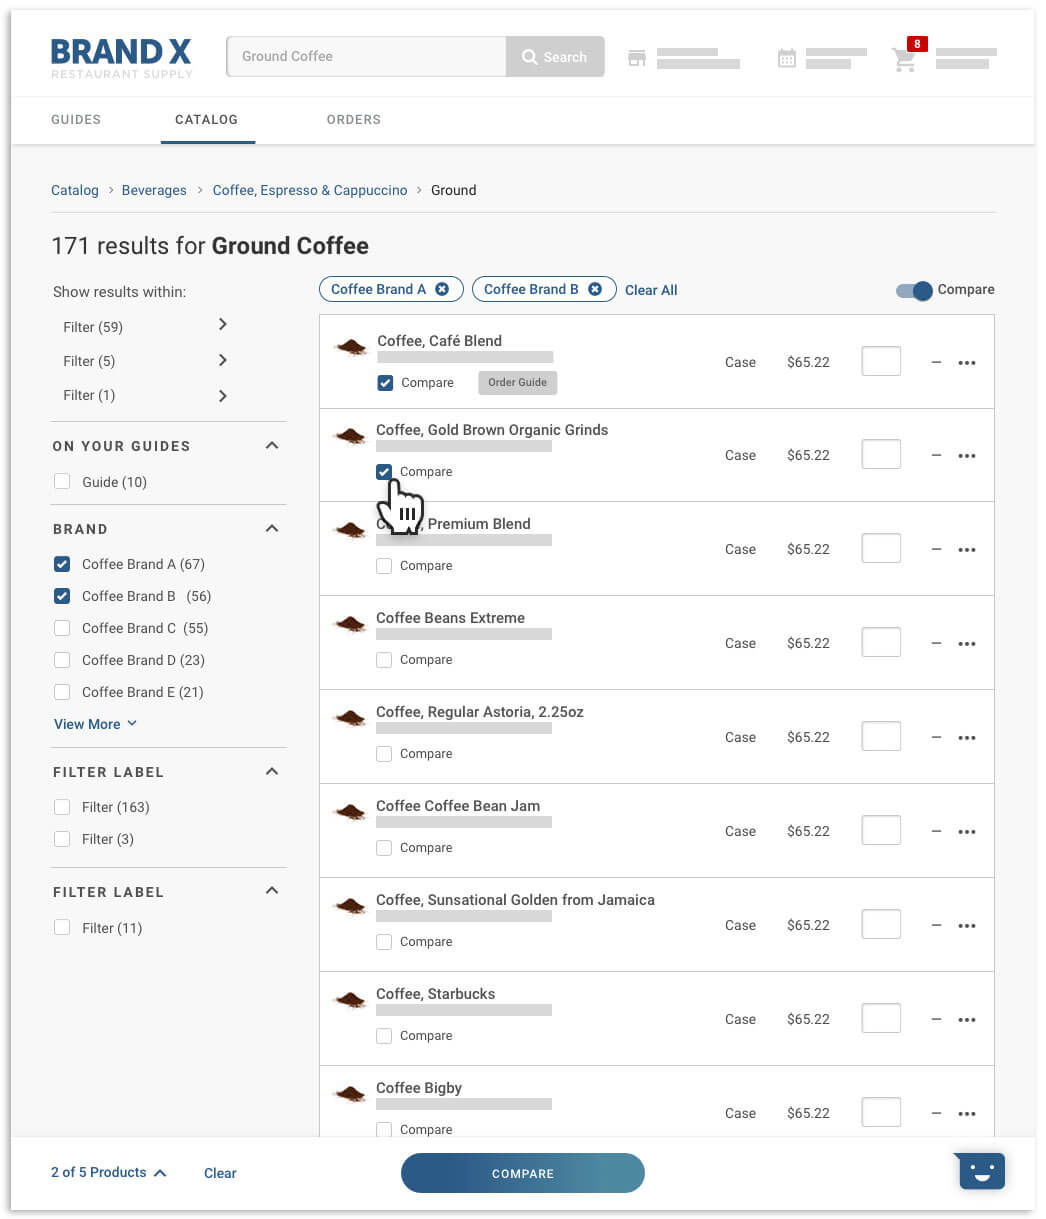
The Online Ordering application is a marketplace. The application is built to optimize the buying and browsing experience. When customer needs and budgets change, we want to save kitchen managers time; give them confidence in choosing the right product; and help them avoid mistakes. Customers asked for a product comparison tool through HotJar.
When I buy on Amazon I am constantly comparing products. I wish I could compare products here.
Kitchen Manager, Chain Restaurant
Audience
Kitchen managers are independent restaurants owners; long-term care, hospital, and institution food & beverage managers; as well as regional and national chains restaurants managers.
Kitchen Managers fit into three categories across a spectrum of business maturity. Nelsons are independent restaurant owners who likely avoid using secondary tools other than spreadsheets and whiteboards. Owens might own or manage a small chain of restaurants and use spreadsheets and third-party apps to help track orders. Finally we serviced Gwens who manage food & beverage operations for large institutions and chains. Gwens are often required to facilitate ordering through third-party apps.
Other than ethnography, other considerations include years of experience, digital prowess, and dependency on reps.
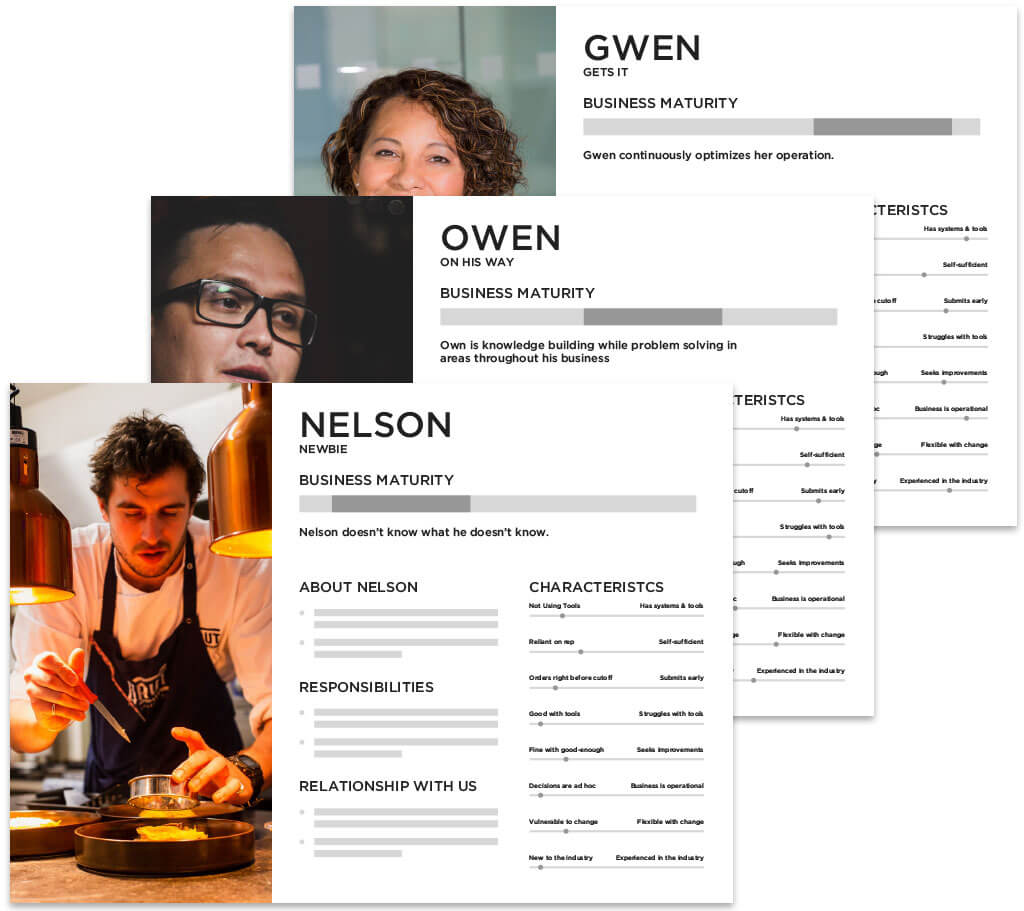
The documents above are simple representations of personas and don’t represent my work.
Process
One of the roles of a UX/UI design is to foster alignment across all participating parties.
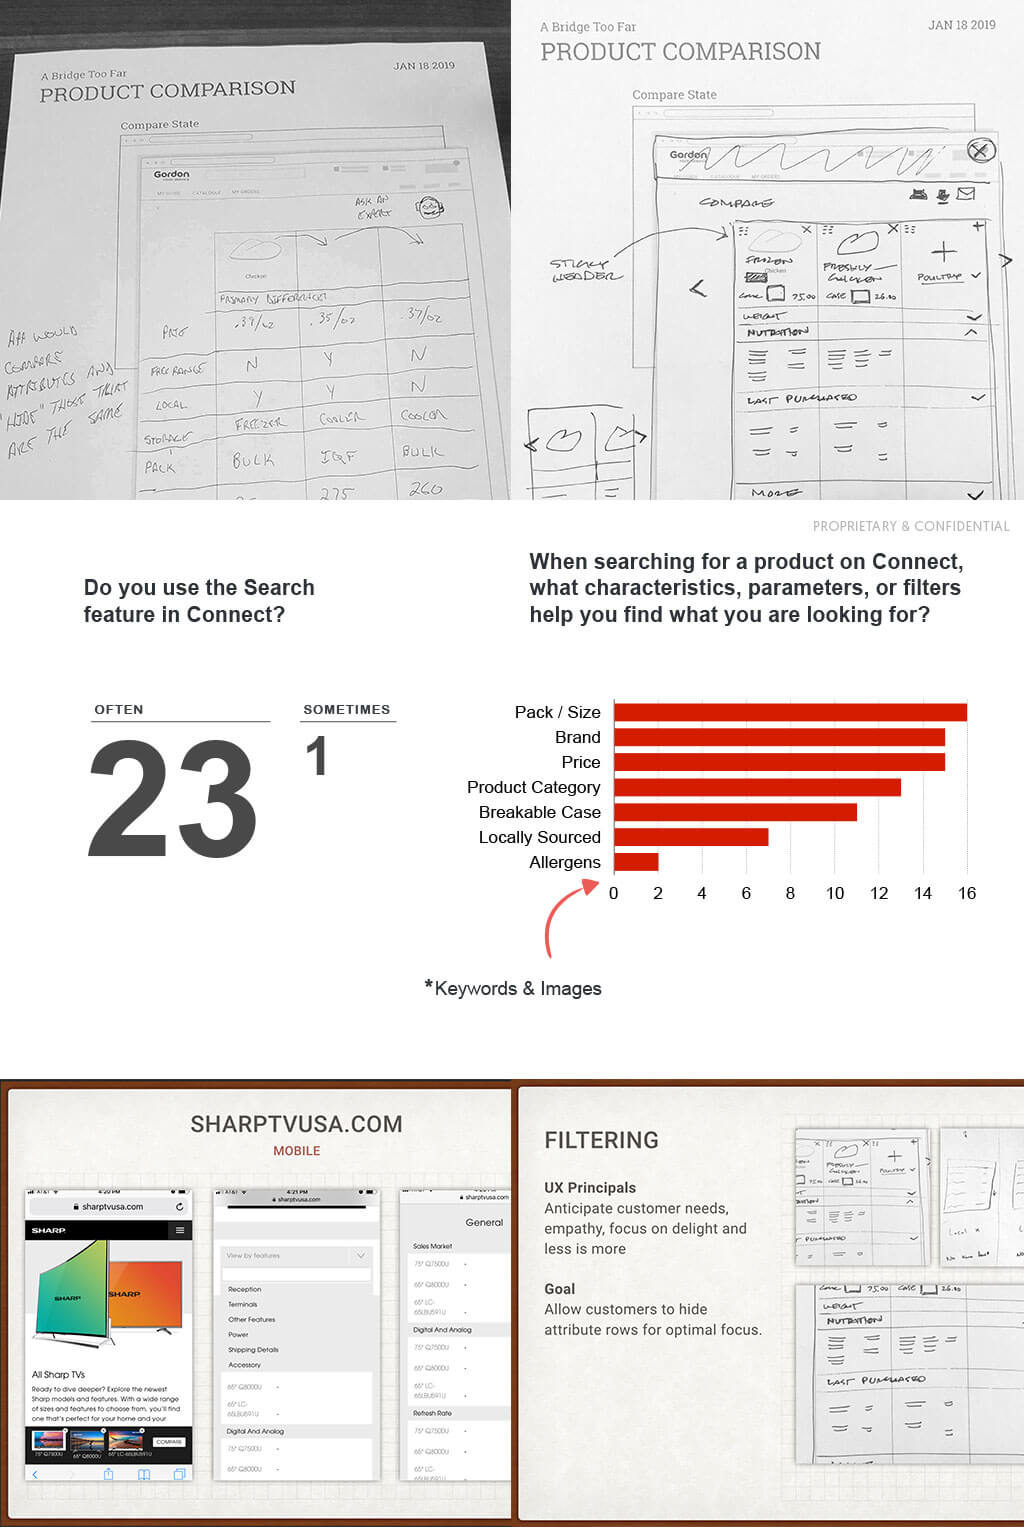
For this feature, I dug into what makes a good product comparison tool and put together a heuristic report showing best practices and acclaimed e-commerce examples. My audience for this presentation was product owners, architects, and developers. This was done over a Google Hangouts call. Though remote, this meeting effectively shaped the scope and goals for our online ordering product comparison tool.
Because chefs and food procurement officers would require most if not all the product details. To get the most useful data, we surveyed over a 250 food professionals. With 54 replies, we discovered the most important product attributes which then influenced the data order, what was shown on load, and what was hidden by collapsable section. Smaller tables are easier to visually digest.
Scope & Constraints
Many customers have experienced an online product comparison tool. By now, they’ve become a familiar design pattern. But not to take anything for granted, I referenced Baymard Institute, Nielsen Norman Group and Smashing Magazine for best practices. Our scope and constraint was to bring a practical comparison experience to the Online Ordering app.
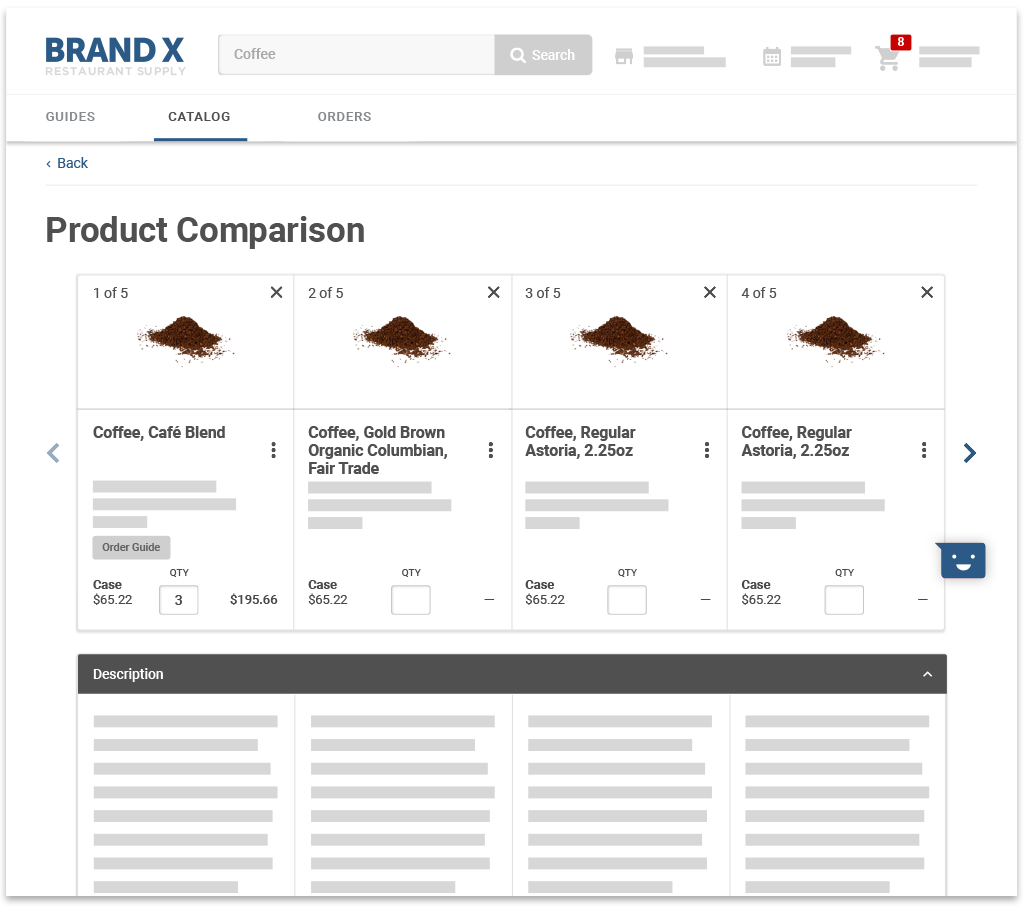
We allowed customers to compare up to 5 items. Though there was some desire to add more, Nielsen Norman Group advocated for 3-4 items. This eliminates information overload and promotes the likelihood of adding one or more items to the cart.
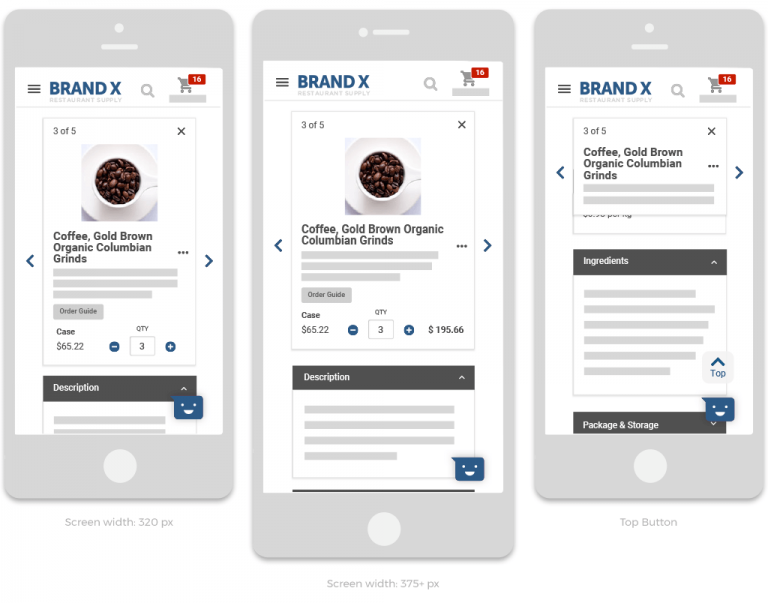
Ideally we would have shipped the tool with data filters to allow customers to parse through data relevant to them. We didn’t do that. Instead, governed by principle to deliver a viable product and improve on demand, we opted for category headers. The headers stretched across all products in a row and came equipped with up and down arrows to show and hide content. In the end, it probably was a cleaner solution and keeping it simple was our goal.
Nearly 25% of our customers build their orders on their smart phones. A vast majority still use iPhone 5. That means, this experience had to be flawless in a 320-pixel wide viewport. This required creating a collapsable product card so on scroll more data could be viewed per item.
The entire project was handled by one feature team (approximately 12-15 people) over a 12-week project increment.
Tools & Research
- JIRA and Trello
- Paper, pen, and pencil
- Keynote
- MailChimp
- Sketch
- InVision
- Abstract
- Google Business Suite
- LogRocket
- Interviewed stakeholders
- Interviewed Kitchen managers
- Sourced best practices from Baymard, Nielsen Norman Group, and Smashing Magazine
- Compiled and presented a competitive analysis
- Built a prototype for stakeholders and developers